 microServiceBus.com DOCS
Get insight using tracking
Though the Console can give you valuable understanding of the execution of your Services, it might not provide insight into your overall processes and messages. -This is where Tracking comes to the rescue.
When enabling Tracking for a Node, the message along with its context for every executed Service will be transmitted to the Tracking database of microServiceBus.com. The data will be automatically deleted after 30 days, but is the single exception to storing content- (payload) and context data (meta data) in microServiceBus.com. Apart from this exception, sensor and meter data sent to the IoT Hub never passes microServiceBus.com.
That being said, it’s a valuable tool when identifying and resolving issues.
Enable Tracking
By default, Tracking is disabled, and you should always remember to disable it when your are done as Tracking will add extensively to your data usage.
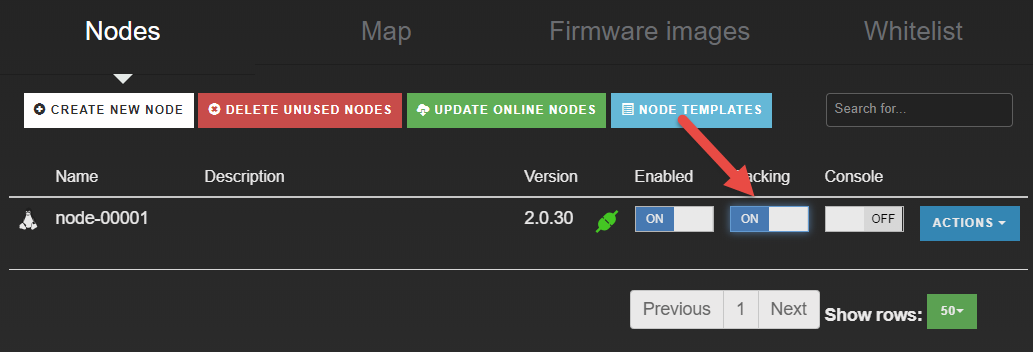
To enable the Tracking, navigate to the Nodes page, and simply toggle the Tracking button of the Node you’d like to work with.
View and query Tracking
Navigate to the Management page using the menu, click the Tracking tab at the top. If your Node has executed any Services since you enabled Tracking you should see a list of events:
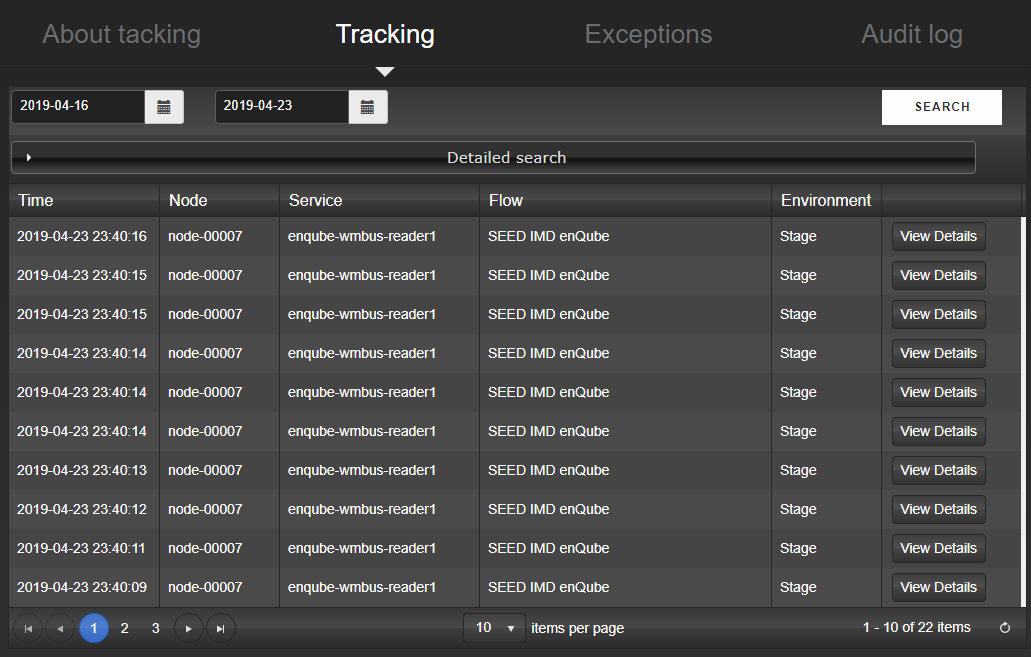
Each line represents one execution of your Flow. Select one of the instances by clicking the View Details button.
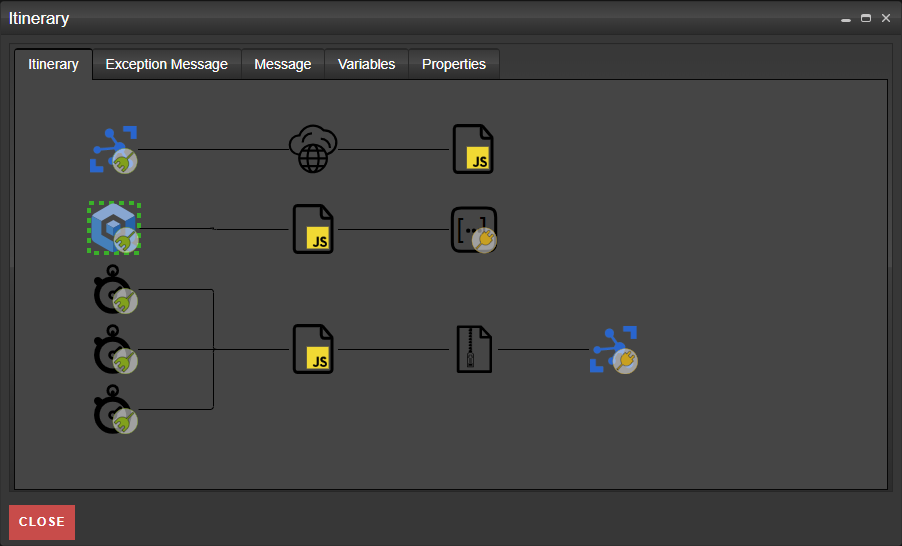
This takes you to a new window, showing a snapshot of the state after each Service executed. The first tab shows you where in the flow the snapshot was captured. The other tabs reveal any errors, what the payload (content) looks like but also variables and metadata (context).
Related content:
- Home
- Common Linux terminal commands
- Get insight using tracking
- Import nodes from CSV files
- Installing microServiceBus-node
- Working with meter configuration
- Migration information
- Node installation scripts
- Work with Node VPN interface and peers
- Reviewing the Audit log
- Roles, privilages and auditing
- Running microServiceBus-node on a yocto image
- Developing JavaScript Services in microServiceBus.com
- Developing Python Services in microServiceBus.com
- Site verification
- Using the Node terminal
- Using the Console
- Default keyboard shortcuts
- Working with service properties
Report bugs, broken links or missing images.. Create Issue