 microServiceBus.com DOCS
Remote debug your microservices
Remote debug your microservices
Microservicebus does not include a specific tool for code debugging, it instead offers the possibility of remote debug using Chrome developing tools.
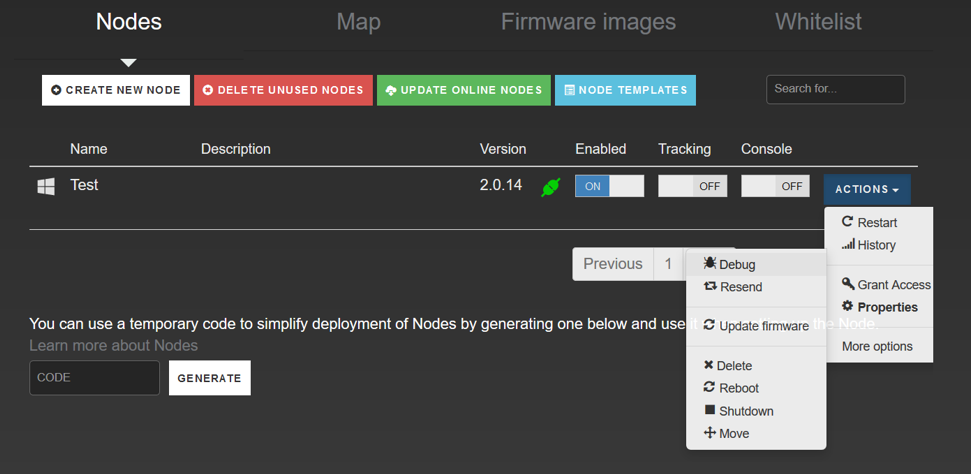
In order to debug remote, the node must be online. You will find the option by clicking on the Actions button, then select Debug under More options.
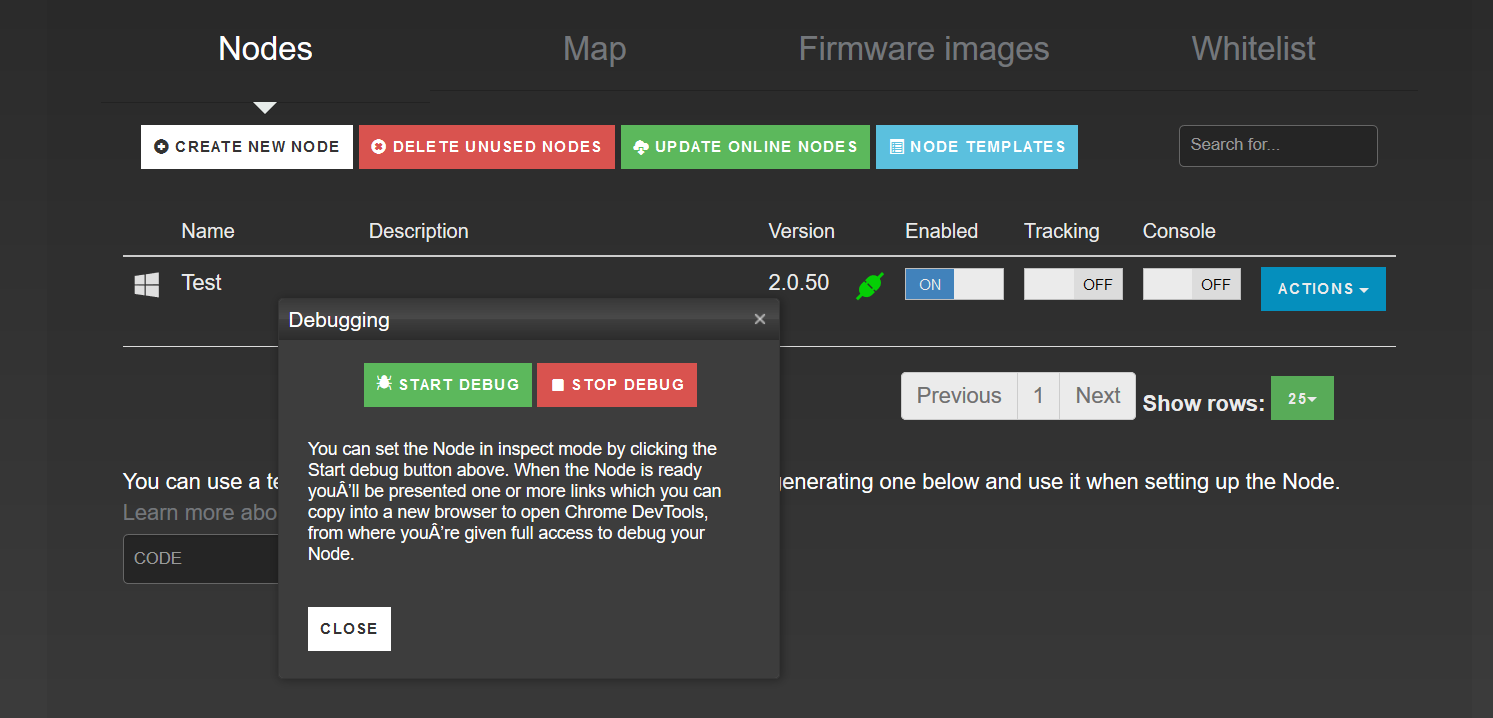
A message window will be displayed with two options: Start and Stop Debug. Start Debug is for initiating the debugging process. That implies the node going into a inspection mode, hence starting a listener event. For this reason, it is important to click on the Stop Debug right after you are done with your work. Or else the link to DevTools will still be active and anyone having access to it will also have direct access to your node.
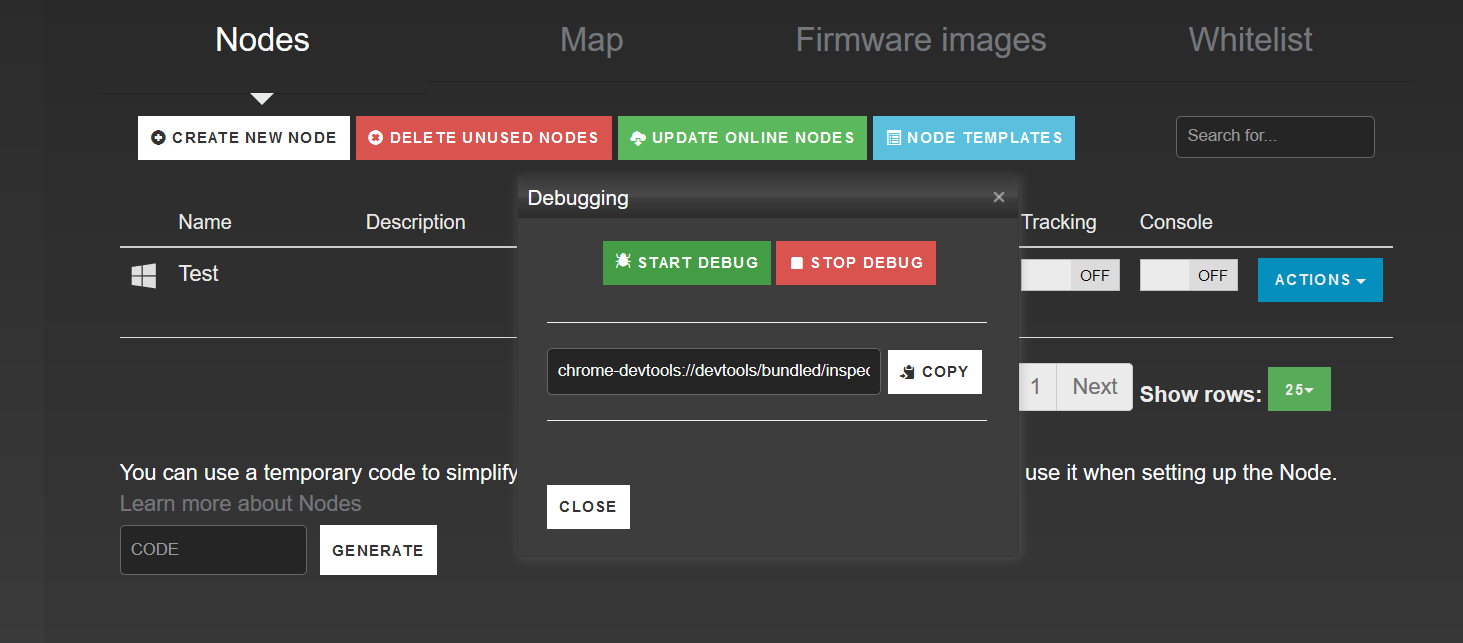
You will be provided with a link which you can open in your web browser to access to your Node in Chrome DevTools. The services in the active flows your node is running will appear in the folder path under Sources > Page. The developing tools will enable you to walk through your code’s execution by setting breakpoints and checking variable values.
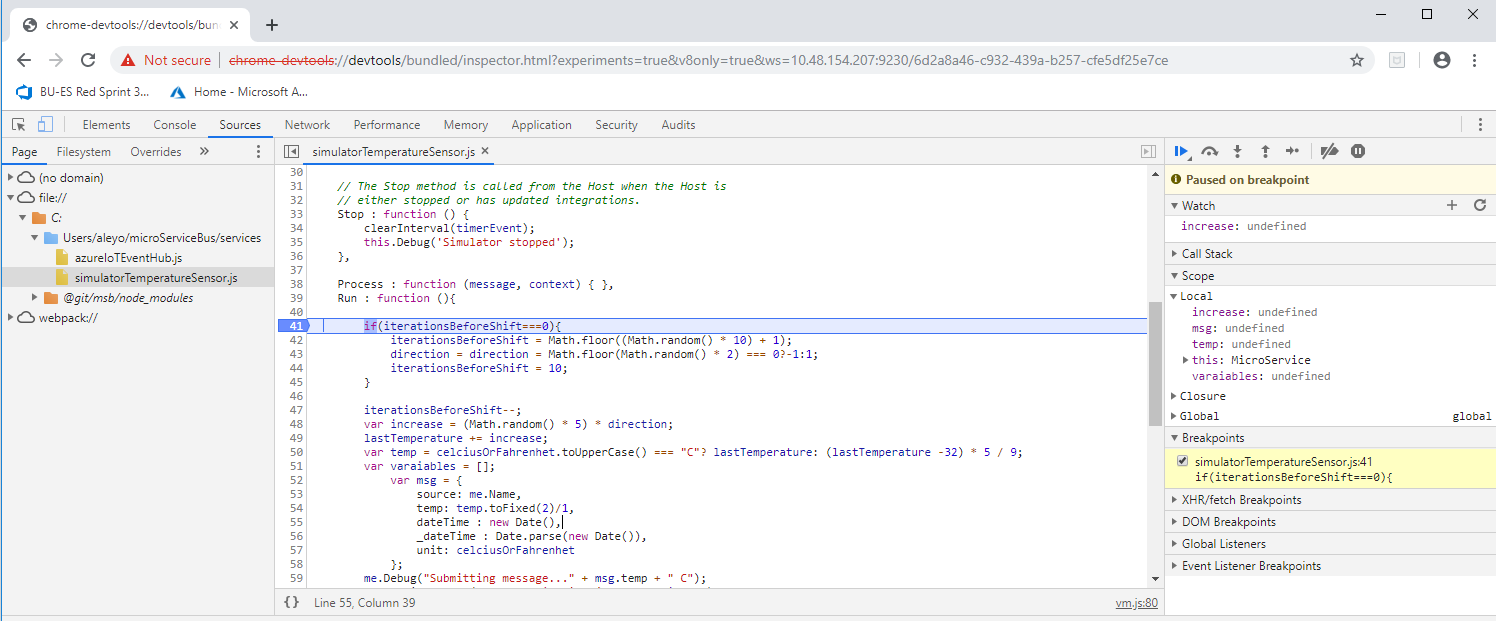
Now you have full access to your device!
Related content:
- Home
- Get insight using tracking
- Import nodes from CSV files
- Installing microServiceBus-node
- Working with meter configuration
- Migration information
- Node installation scripts
- Work with Node VPN interface and peers
- Remote debug your microservices
- Reviewing the Audit log
- Roles, privilages and auditing
- Run background services
- Running microServiceBus-node on a yocto image
- Services and Scripts in microServiceBus.com in depth
- Site verification
- Using the Node terminal
- Using the Console
- Default keyboard shortcuts
- Working with service properties
Report bugs, broken links or missing images.. Create Issue